In 2025, a staggering 70% of digital transformation initiatives fail not because the technology is flawed, but because businesses lack the right way to measure success. Enter digital & technical KPIs: the metrics that cut through the noise and reveal what’s actually working and what’s costing you time and money. From tracking system uptime to measuring user engagement, these KPIs give you a crystal-clear view of your digital performance, helping you make smarter, faster, and data-driven decisions.
Imagine knowing exactly which digital investments are driving growth, which systems need optimization, and how your team’s efforts translate into tangible results. Without these KPIs, companies are flying blind, chasing metrics that look good but don’t move the needle. With them, you get a roadmap to operational efficiency, better customer experiences, and real innovation.
In this guide, we’ll uncover the most critical digital & technical KPIs, explain how to measure them effectively, and show why mastering these metrics is no longer optional; it’s essential for any organization aiming to thrive in a digital-first world.
Understanding Digital & Technical KPIs
While KPIs have long been a cornerstone of business performance measurement, traditional KPIs often focus on broad business outcomes such as revenue growth, profit margins, or employee productivity. They provide a high-level view but can fall short in measuring the complex, technology-driven operations that underpin modern digital initiatives.
This is where digital & technical KPIs make the difference. These KPIs drill deeper into the performance of your digital assets, IT systems, and technology-led processes. They don’t just measure output; they measure effectiveness, efficiency, and impact.
For example, instead of simply tracking total website visits (a traditional metric), a digital KPI might track conversion rates, load times, or error rates, giving actionable insights that directly influence business outcomes.
Categories of Digital & Technical KPIs
1. Operational KPIs
| Focus | System performance, uptime, and process efficiency. |
| Example | A cloud services company like Amazon Web Services tracks server uptime and response times using ITIL-based frameworks to ensure reliability for millions of users. |
2. Customer-Centric KPIs
| Focus | User engagement, satisfaction, and adoption. |
| Example | Netflix monitors metrics like streaming quality, buffering rates, and viewer retention to optimize the user experience and improve NPS (Net Promoter Score). |
3. Financial & ROI KPIs
| Focus | Cost efficiency and value generated from technology investments. |
| Example | Microsoft evaluates the ROI of its cloud services by comparing infrastructure costs against revenue growth and adoption rates. |
Many leading companies integrate these KPIs into recognized frameworks such as the Balanced Scorecard for strategic alignment or ITIL for IT service performance. This ensures that KPIs aren’t just numbers; they’re actionable insights that drive informed decisions, optimize processes, and maximize business impact.
In essence, understanding the distinction and relevance of digital & technical KPIs is the foundation of data-driven digital transformation. They provide not just visibility but also control and foresight, enabling organizations to proactively address issues and seize growth opportunities.
Next-Gen KPIs for Digital Transformation

As we navigate 2025, the landscape of digital transformation is evolving rapidly. Traditional Key Performance Indicators (KPIs) are no longer sufficient to capture the complexities of modern digital initiatives. Enter next-generation KPIs, which are intricately designed to measure the effectiveness of AI, cloud computing, and automation in real-time business contexts.
➤ What Makes Next-Gen KPIs Different?
Next-gen KPIs transcend the limitations of traditional metrics by focusing on:
| Real-Time Performance | Monitoring systems and processes as they operate, allowing for immediate adjustments. |
| Customer-Centric Metrics | Emphasizing user experience and satisfaction to align with business objectives. |
| Operational Efficiency | Assessing the impact of digital tools on productivity and cost-effectiveness. |
These KPIs are not just numbers; they are strategic indicators that provide actionable insights into the success of digital transformation efforts.
➤ Aligning with Business Strategy and Digital Maturity
Implementing next-gen KPIs ensures that digital initiatives are in harmony with overarching business strategies. They facilitate:
| Strategic Alignment | Ensuring that digital efforts contribute directly to business goals. |
| Continuous Improvement | Providing data that drives iterative enhancements in digital processes. |
| Scalability | Allowing businesses to measure and manage growth effectively. |
By integrating these KPIs, organizations can achieve a higher level of digital maturity, characterized by agility, responsiveness, and sustained innovation.
Real-World Applications
Leading companies are already leveraging next-gen KPIs to drive their digital transformation:
- Walmart: Utilizing AI to optimize inventory management and enhance customer service across its vast network of stores.
- KPMG: Investing in AI partnerships to develop tailored solutions for clients in various sectors, aiming for significant growth through digital innovation.
These examples illustrate how next-gen KPIs are instrumental in navigating the complexities of digital transformation and achieving tangible business outcomes.
Top 10 Key Digital & Technical KPIs With Examples Are as Follows:
To successfully navigate digital transformation, organizations must focus on KPIs that provide actionable insights, monitor progress, and align with strategic goals. Here’s a detailed look at the most critical metrics, with examples and clear takeaways:
1. Employee Productivity
Definition: Measures how efficiently employees use digital tools to complete tasks.
Key Points:
- Tracks time spent on tasks before and after implementing digital tools.
- Identifies workflow bottlenecks and opportunities for automation.
- Enhances workforce allocation and operational efficiency.
Example: A global consulting firm implemented a project management platform and saw task completion rates increase by 20% within three months, highlighting the impact of digital & technical KPIs on workforce optimization.
2. Digital Adoption Rate
Definition: Percentage of employees actively using new digital tools and platforms.
Key Points:
- Highlights engagement with digital initiatives.
- Low adoption signals a need for training or additional support.
- High adoption accelerates ROI and operational benefits.
Example: A retail chain tracked employee logins and feature usage after rolling out an inventory management system. Adoption surged to 85% within 2 months, reflecting successful change management.
3. System Uptime & Reliability
Definition: Measures the availability and stability of digital systems and infrastructure.
Key Points:
- Critical for cloud platforms, websites, and internal IT systems.
- Minimizes operational disruption and prevents customer complaints.
- Often benchmarked against industry standards, e.g., 99.9% uptime.
Example: An e-commerce platform maintained 99.9% uptime using monitoring tools, ensuring a seamless shopping experience and demonstrating how digital & technical KPIs can safeguard operational reliability.
4. Customer Satisfaction (CSAT) Score
Definition: Gauges how satisfied customers are with digital products or services.
Key Points:
- Collected via surveys, in-app feedback, or post-purchase forms.
- Directly impacts retention, loyalty, and repeat business.
- Helps identify UX issues or feature gaps for continuous improvement.
Example: A SaaS company recorded a CSAT increase from 78% to 92% after implementing UI enhancements, reflecting tangible improvements in customer experience.
5. Net Promoter Score (NPS)
Definition: Measures customer loyalty and the likelihood of recommending a product or service.
Key Points:
- Simple yet powerful indicator of brand advocacy.
- Segments promoters, passives, and detractors for targeted strategies.
- Guides product, marketing, and support improvements.
Example: A mobile app developer saw NPS rise from 45 to 68 after introducing AI-driven personalization features, showcasing the impact of well-chosen digital & technical KPIs on customer loyalty.
6. Cost Savings from Automation
Definition: Quantifies financial savings achieved through process automation.
Key Points:
- Highlights efficiency gains and ROI of technology investments.
- Identifies areas for further digital optimization.
- Supports business cases for scaling automation initiatives.
Example: A financial institution automated manual data entry, reducing operational costs by 30% annually, showing the tangible benefits of process automation.
7. Time-to-Market for New Features
Definition: Measures the speed of developing and launching new digital features.
Key Points:
- Shorter cycles indicate agile, responsive development.
- Enables faster adaptation to market trends and customer demands.
- Improves competitive advantage and overall business agility.
Example: A SaaS company reduced feature delivery from six months to three months, using digital & technical KPIs to track and optimize development efficiency.
8. Return on Digital Investment (RODI)
Definition: Assesses financial return on digital initiatives.
Key Points:
- Compares revenue gains or cost savings against investments.
- Validates the effectiveness of digital strategies.
- Helps prioritize high-impact projects and budget allocation.
Example: A manufacturing firm calculated a 15% increase in revenue post-implementation of IoT-driven smart factory solutions, proving the effectiveness of strategic digital investments.
9. User Engagement Metrics
Definition: Tracks how users interact with digital platforms and services.
Key Points:
- Includes session duration, page views, clicks, and bounce rate.
- Reveals UX/UI effectiveness and content relevance.
- Guides personalization, retention strategies, and product improvements.
Example: Bounce rates decreased by 40%, and average session duration increased by 50%, indicating higher user engagement and satisfaction.
10. Innovation Rate
Definition: Measures the frequency of new digital initiatives, features, or improvements.
Key Points:
- Indicates organizational adaptability and digital maturity.
- Encourages a culture of continuous improvement.
- Correlates with competitiveness and market growth.
Example: After a remarkable 25% jump in value from 2023 to 2024, this year’s Cloud 100 list accelerated even further with a jump of +36%, reaching its new record height of $1.1 trillion.
Focusing on these key digital & technical KPIs allows organizations to gain measurable, actionable, and strategic insights. Companies that track these metrics can align operations with business goals, optimize performance, and accelerate ROI, making these KPIs indispensable for successful digital transformation.
How to Measure Digital & Technical KPIs?
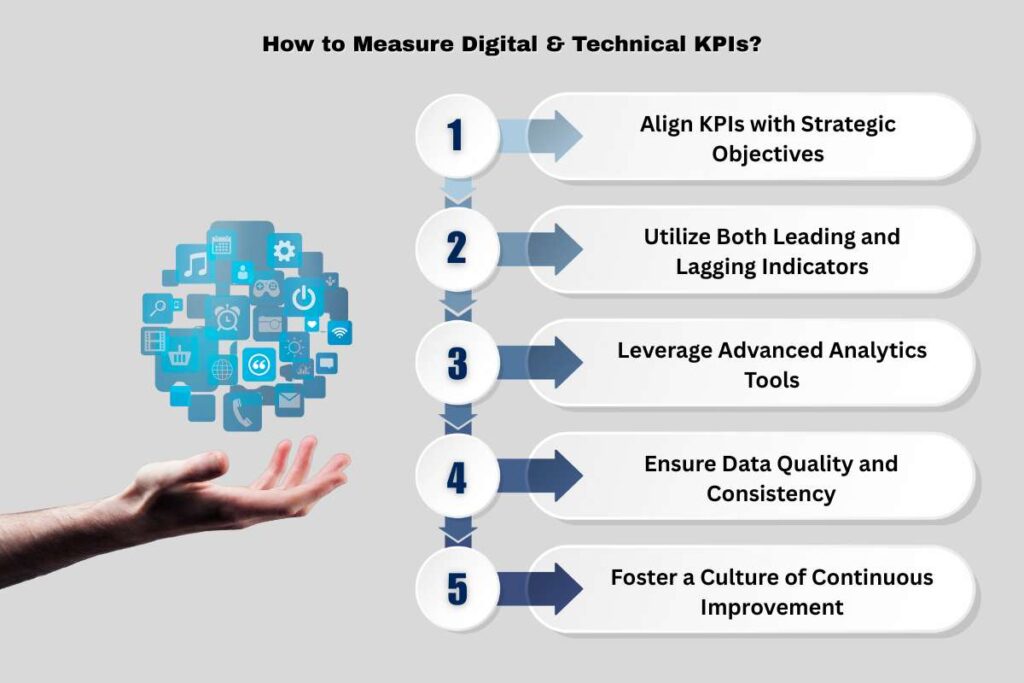
Measuring the effectiveness of digital transformation initiatives requires more than just tracking numbers; it involves aligning metrics with strategic goals, ensuring data quality, and fostering a culture of continuous improvement. Here’s how to effectively measure your KPIs:
1. Align KPIs with Strategic Objectives
Ensure that each KPI directly supports your organization’s overarching goals. This alignment helps in:
- Clarifying Purpose: Every metric should have a clear connection to business outcomes.
- Driving Focus: Teams can prioritize efforts that contribute most to strategic objectives.
- Enhancing Accountability: Clear KPIs make it easier to assign responsibility and track progress.
Example: A financial services firm aligned its digital adoption rate with customer satisfaction goals, leading to a 15% improvement in CSAT scores over six months.
2. Utilize Both Leading and Lagging Indicators
Incorporate a mix of leading indicators (predictive metrics) and lagging indicators (outcome-based metrics) to get a comprehensive view:
- Leading Indicators: Metrics like system uptime, employee engagement, and digital adoption rate provide early signals of performance.
- Lagging Indicators: Metrics such as ROI, customer satisfaction, and revenue growth confirm the outcomes of digital initiatives.
Example: The reality is that most e-commerce platforms, like Shopify, Magento, BigCommerce, etc., offer high levels of uptime availability. Shopify promises 99.9% uptime.
3. Leverage Advanced Analytics Tools
Employ analytics platforms to gain deeper insights:
- Predictive Analytics: Forecast future trends and potential challenges.
- Cohort Analysis: Understand behavior patterns of different user groups.
- Sentiment Analysis: Gauge customer feelings and feedback.
Example: According to research by Gartner, organizations that deploy advanced predictive analytics for churn reduction see a 25-50% improvement in retention rates compared to those using standard reporting methods.
4. Ensure Data Quality and Consistency
Accurate and consistent data is crucial:
- Data Governance: Implement policies to maintain data integrity.
- Regular Audits: Periodically review data sources and processes.
- Standardization: Use consistent formats and definitions across the organization.
Example: A healthcare provider standardized data entry protocols, resulting in a 25% reduction in data discrepancies.
5. Foster a Culture of Continuous Improvement
Encourage teams to view KPIs as tools for growth:
- Regular Reviews: Hold quarterly KPI review sessions.
- Feedback Loops: Use KPI outcomes to inform strategy adjustments.
- Celebrating Wins: Recognize achievements to motivate teams.
Example: A manufacturing company implemented monthly KPI reviews, leading to a 30% improvement in process efficiency over a year.
Effectively measuring digital & technical KPIs requires a strategic approach that combines alignment with business objectives, utilization of advanced analytics, and a commitment to data quality and continuous improvement. By adopting these practices, organizations can ensure that their digital transformation efforts are not only measurable but also impactful.
Best Practices for Reporting and Communicating Digital & Technical KPIs
Tracking KPIs is only half the battle. The real value comes from communicating insights effectively so stakeholders can make informed decisions. Here are the best practices to ensure you deliver maximum impact:
| Best Practice | What It Means |
| Tailor Reports to Audience | Customize KPI reports for executives, managers, and teams. |
| Use Visual Dashboards | Present data with charts, graphs, heatmaps, and interactive filters. |
| Focus on Key Metrics | Track only KPIs that align with business objectives. |
| Provide Context | Include benchmarks, targets, and historical trends. |
| Automate Reporting | Use automated tools to reduce errors and save time. |
| Foster Action-Oriented Communication | Ensure KPI reports lead to decisions or next steps. |
Effective reporting of digital & technical KPIs transforms raw data into actionable intelligence. By tailoring reports, using visual dashboards, focusing on key metrics, and providing context, organizations empower teams to make smarter, faster, and data-driven decisions driving successful digital transformation.
Importance of Digital & Technical KPIs
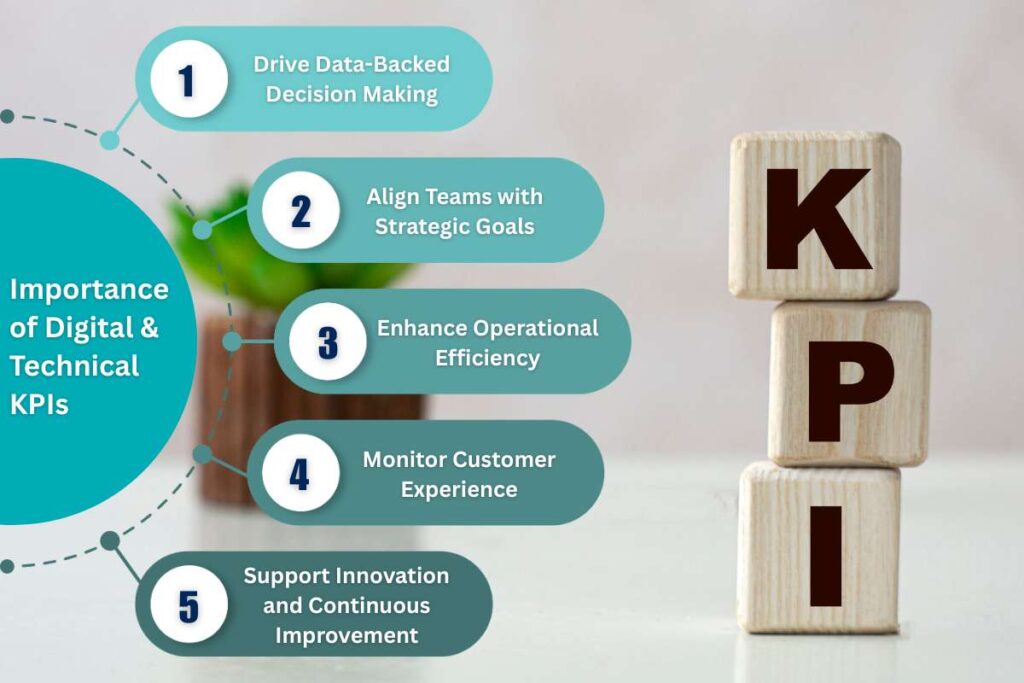
KPIs are not just numbers; they are strategic tools that provide visibility, accountability, and direction for modern organizations. Properly defined KPIs help businesses measure progress, optimize operations, and achieve growth in a digital-first world.
1. Drive Data-Backed Decision Making
- KPIs provide objective insights instead of relying on intuition.
- Enable leaders to identify what’s working and what needs adjustment.
Example: Netflix uses engagement KPIs to decide which content investments yield the highest ROI, ensuring data-driven content strategies.
2. Align Teams with Strategic Goals
- Ensure all departments work toward common objectives.
- KPIs bridge the gap between digital initiatives and business outcomes.
Example: A multinational bank aligned its IT system uptime KPIs with customer service goals, reducing downtime by 15% and improving client satisfaction.
3. Enhance Operational Efficiency
- Highlight process inefficiencies, bottlenecks, and opportunities for automation.
- Help optimize resource allocation and reduce waste.
Example: Studies show that optimized routes can cut delivery times by up to 20%. This is important for quick commerce, where speed matters.
4. Monitor Customer Experience
- Measure satisfaction, engagement, and loyalty to improve user-centric strategies.
- Direct correlation between digital performance and customer retention.
Example: Shopify monitors CSAT and NPS after platform updates, resulting in 10% higher merchant retention.
5. Support Innovation and Continuous Improvement
- Track the pace and impact of new initiatives to ensure competitive advantage.
- Encourage teams to adopt a culture of continuous learning and improvement.
Example: A tech startup measured innovation rate KPIs and increased feature releases by 25% annually, maintaining market relevance.
Conclusion
Digital & Technical KPIs are more than just numbers; they are strategic tools that guide organizations toward measurable success. They help optimize operations, enhance customer experience, validate digital investments, and drive innovation.
By aligning KPIs with business goals, leveraging analytics, and fostering continuous improvement, companies can transform insights into actionable decisions. Real-world examples show that effective KPI tracking leads to higher productivity, faster time-to-market, and improved customer satisfaction.
Key Takeaway: Focusing on the right KPIs empowers organizations to make smarter decisions, boost performance, and achieve sustainable growth in a digital-first world.
FAQs on Digital & Technical KPIs
1. What are Digital & Technical KPIs?
KPIs are measurable values used to track the performance of digital initiatives, IT systems, and technology-driven processes. They help organizations understand operational efficiency, customer engagement, and the ROI of digital investments.
2. Why are Digital & Technical KPIs important?
They provide actionable insights for decision-making, help align teams with business goals, optimize operational processes, monitor customer experience, and validate ROI on technology investments.
3. How do Digital & Technical KPIs differ from traditional KPIs?
Traditional KPIs often focus on revenue, profit, or broad performance metrics. KPIs are more granular, tracking digital adoption, system reliability, user engagement, and automation efficiency.
4. How often should organizations measure these KPIs?
○ Operational KPIs: Daily or weekly, to monitor system performance and uptime.
○ Customer-Centric KPIs: Monthly or after product updates, to track satisfaction and engagement.
○ Financial/ROI KPIs: Quarterly or annually, to assess long-term digital investment returns.
5. What tools can help measure Digital & Technical KPIs?
○ Analytics Platforms: Google Analytics, Adobe Analytics, Mixpanel
○ Business Intelligence Tools: Power BI, Tableau, Looker
○ Project & Productivity Tools: Jira, Asana, Trello